


.svg)
.png)

.svg)


Effortlessly create assessments that precisely evaluate student's understanding.


.svg)
Tutero makes it easy to create resources tailored to your students’ comprehension levels — helping you target specific learning gaps.
It automatically pulls in data from your assessments to guide what to focus on next.
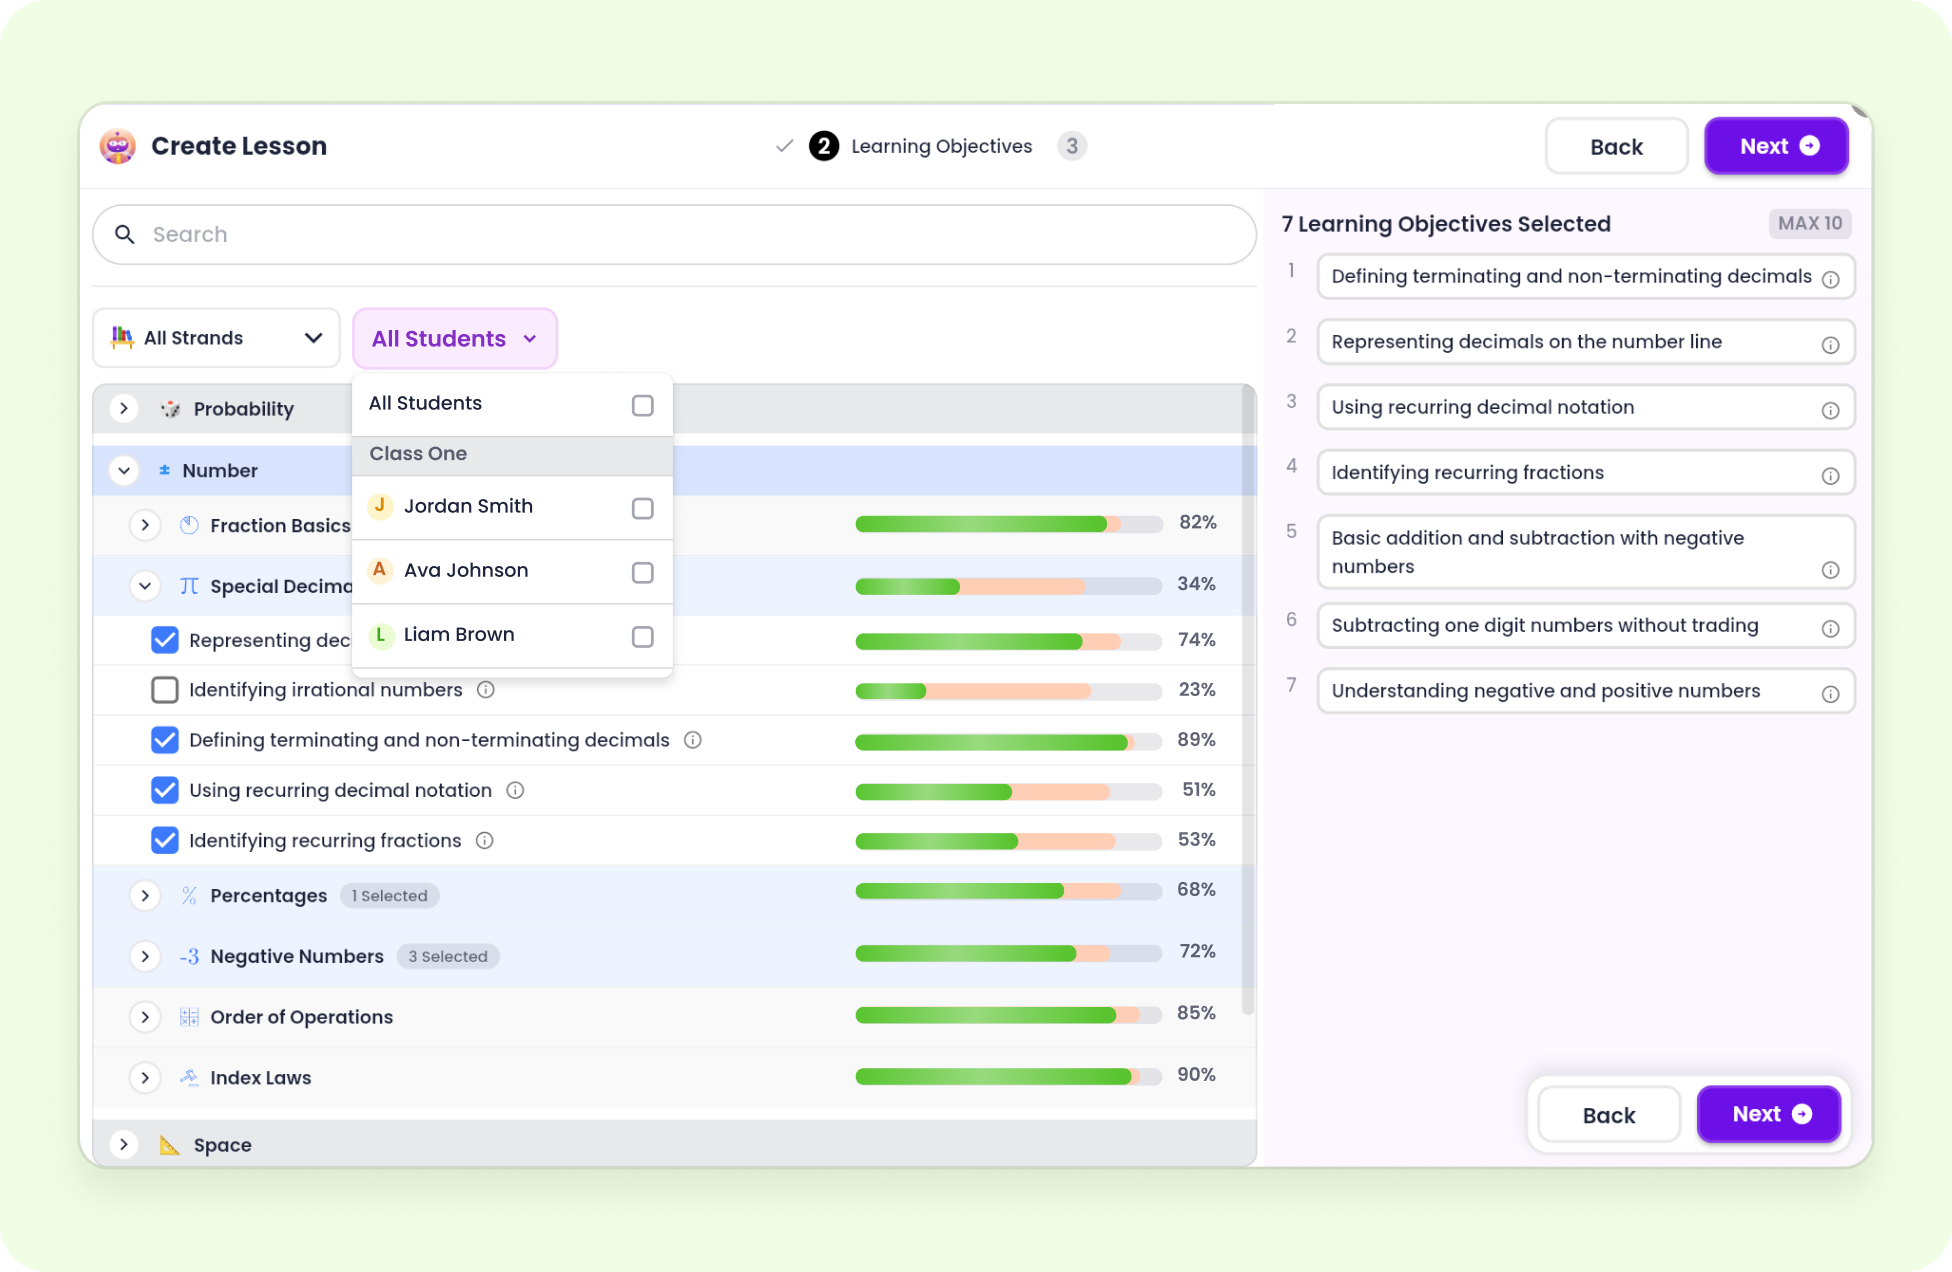
Automatically map planning with outcomes
Tailor assessments to your preferences, and concepts

Identify gaps in student understanding with accuracy
.avif)
Digital and printable formats to suit your needs
.avif)


Tutero’s assessments are carefully crafted to align with the Australian Curriculum, guaranteeing that your evaluation tools meet national standards. Our assessments cover essential learning areas and objectives, simplifying the task of delivering effective and compliant evaluations. Whether you're focusing on numeracy, problem-solving, or practical applications, our resources are tailored to support every aspect of the curriculum.
Our extensive range of assessments supports students from Year 1 to Year 12 across every subject — with structured, engaging evaluation content for every level. Each assessment includes specific objectives, clear success criteria, and data analytics to cater to the diverse needs of your students. From foundational concepts to advanced topics, Tutero provides customisable assessments to help your students succeed.
Tutero’s assessment tool is designed to accurately evaluate student knowledge and identify learning gaps. It offers targeted exercises and diagnostics that provide clear insights into students’ strengths and areas needing improvement, so educators can make informed decisions to support and enhance each student’s learning journey.
Tutero’s assessments are designed to help teachers efficiently evaluate student understanding with minimal preparation time. Customise assessments to fit the unique needs of your classroom, ensuring they align perfectly with your teaching goals. Each assessment is accompanied by clear guidelines and criteria, enabling you to create effective evaluations that accurately reflect your student's knowledge and highlight areas for improvement.
.svg)
